PhD Job Placement & Career Information
Job Placement Information
At Ohio State's Department of English, we feel that it is important to let prospective and current graduate students know as much as possible about the career outcomes of our alums. The following information provides detailed information about the jobs our English PhD alums currently occupy and our overall job-placement statistics.
English PhD Job Placements Since 2001
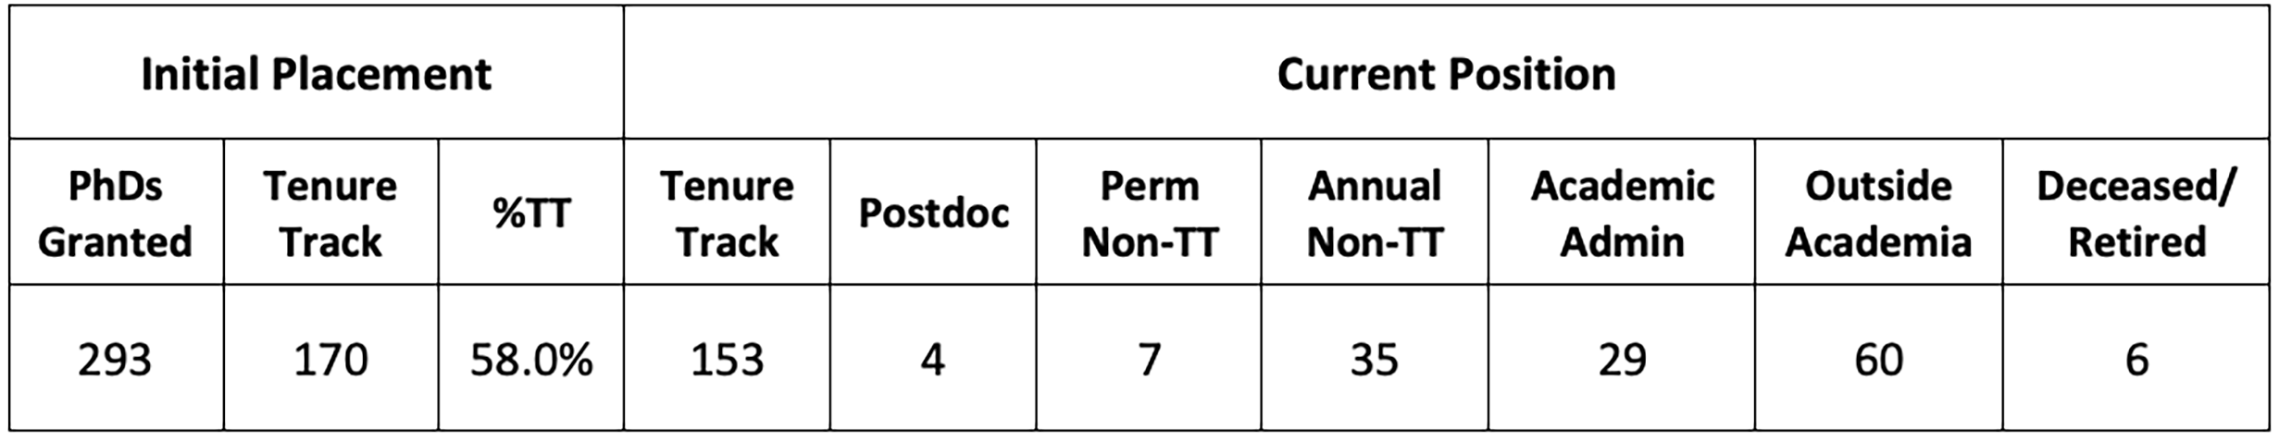
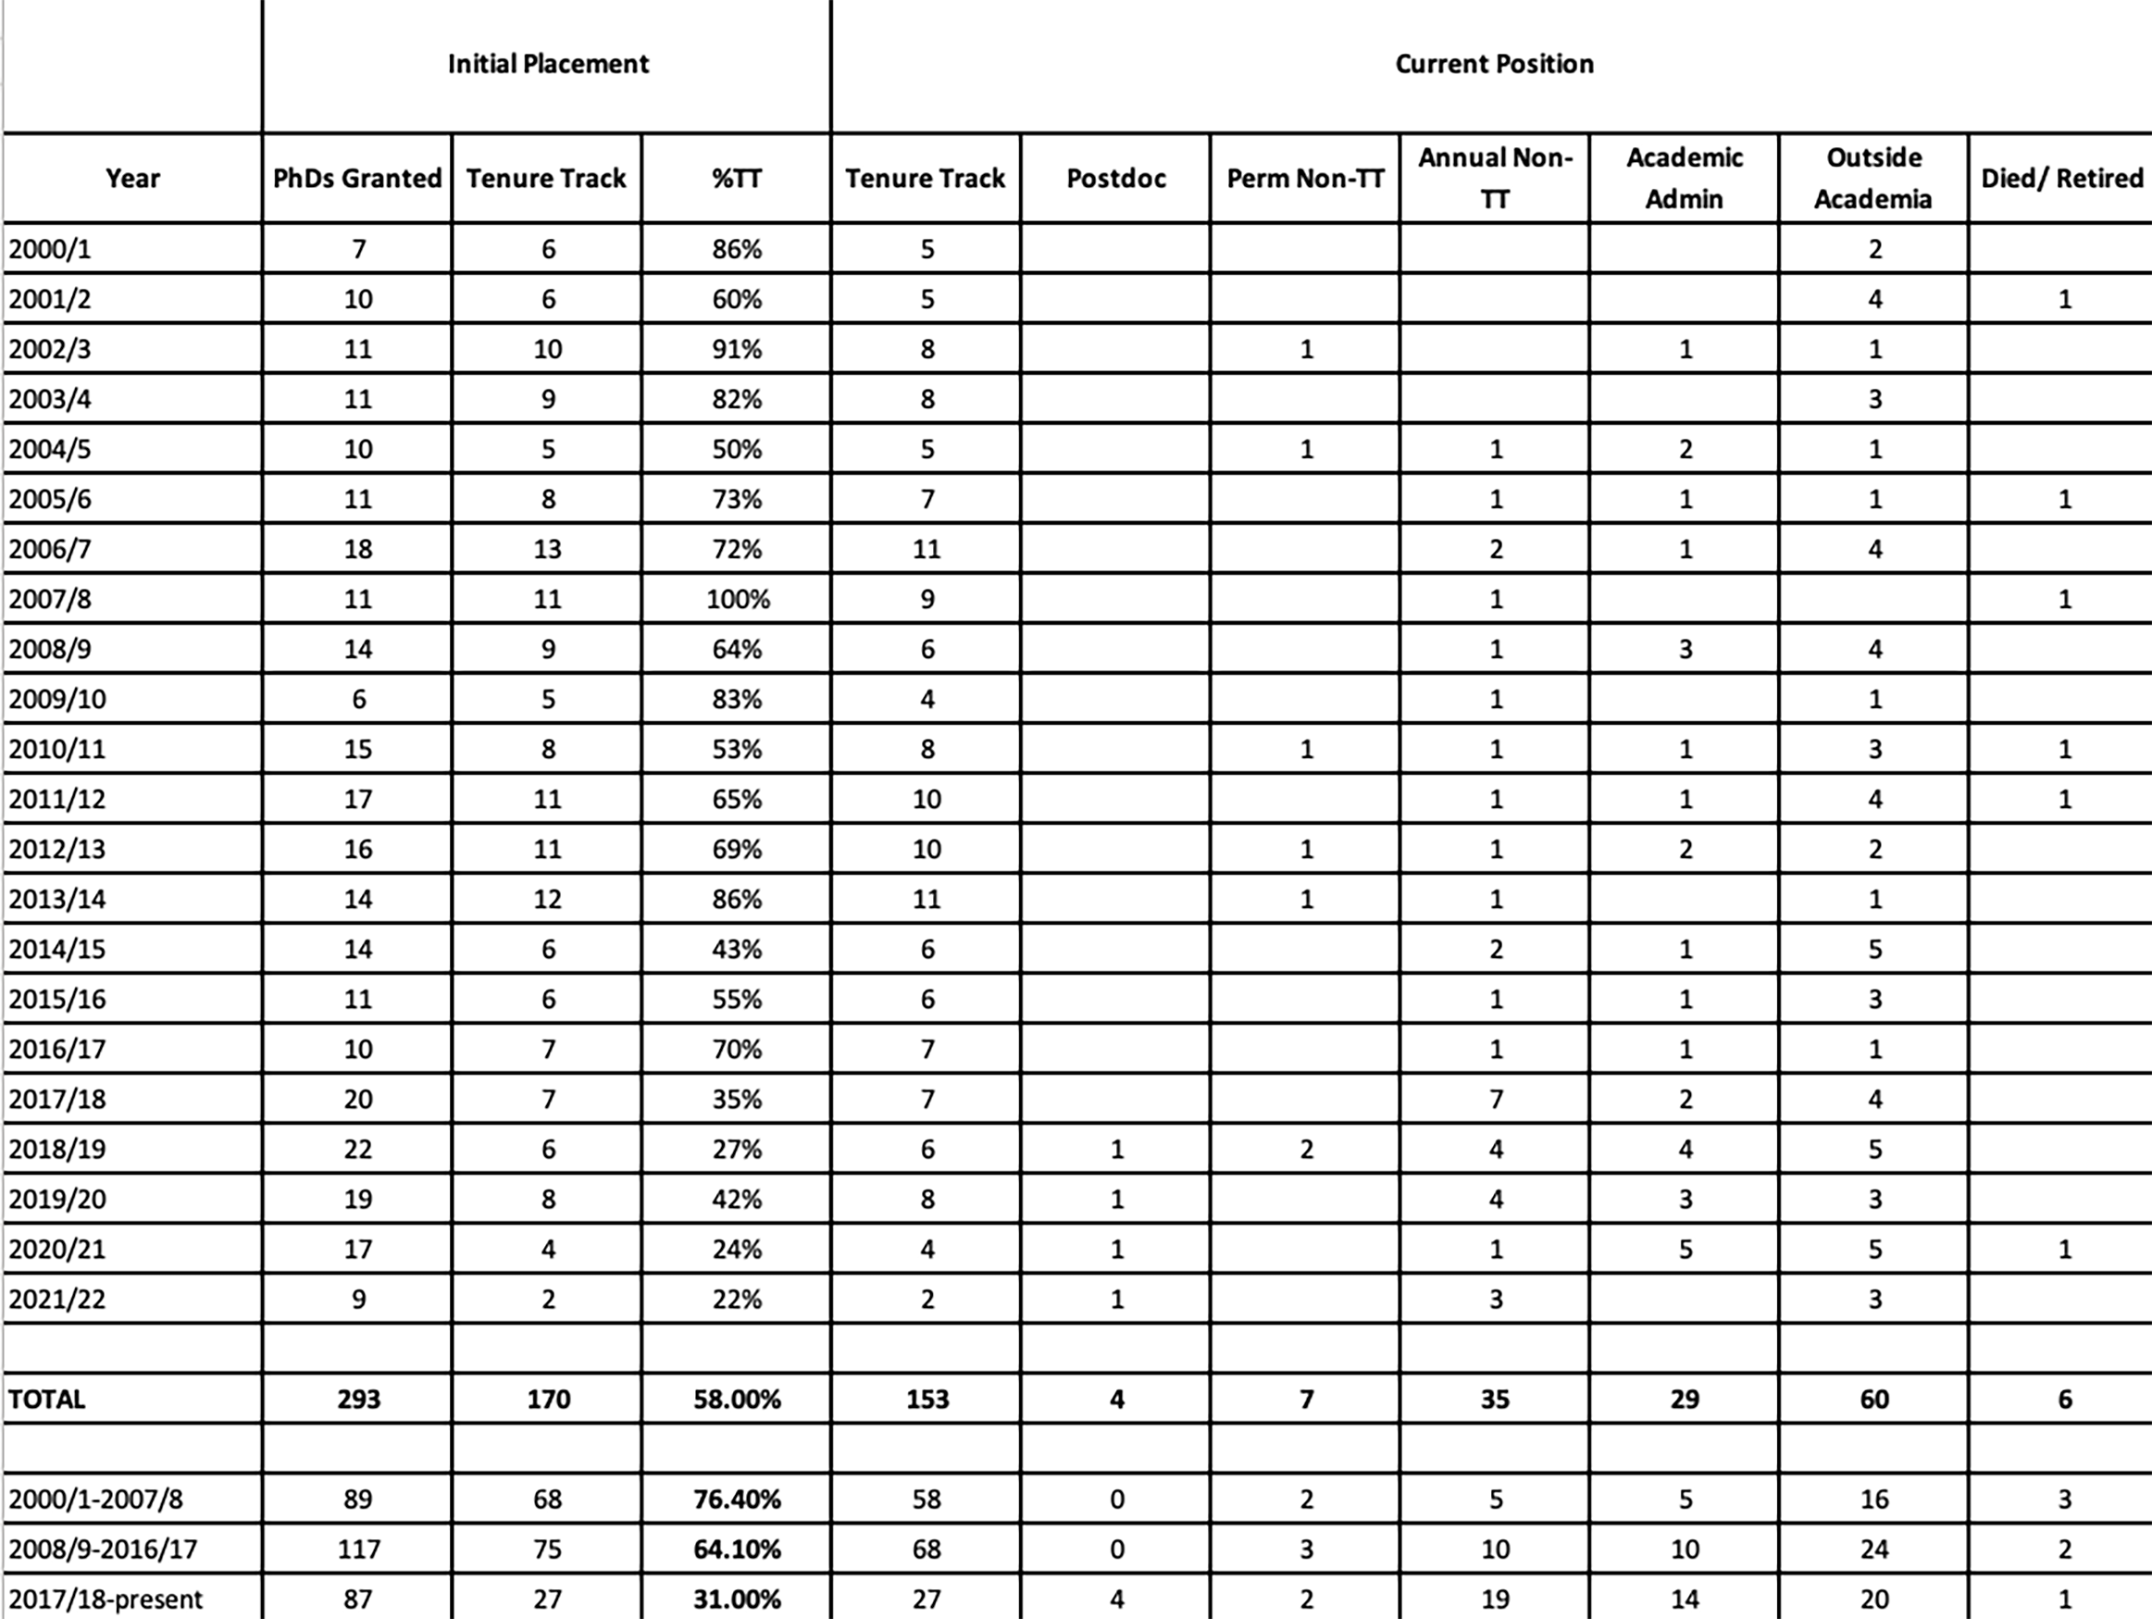
Image Description: This table provides comprehensive numbers of the types of jobs English PhDs occupy. Of the 293 PhDs who received their degrees since 2001, 170 (or 58%) entered tenure-track professor positions. Four have postdocs; seven are in non-tenure track-teaching positions; 35 are in annual non-tenure-track jobs; 29 are in academic administration; 60 have jobs outside of academia; and six have either retired or died.
A more complete, year-by-year accounting of our placements is below, in the accordion labeled "Comprehensive data."
The Tenure Track and Beyond
We supply this data focusing on tracking tenure-track placements for a few reasons: historically, the majority of our PhDs have gained t-t positions; data about t-t placements is a commonly used metric among programs nationally, so this information helps students who are comparing departments; though career objectives among applicants to our PhD programs are changing, it is still the case that many students apply to our program in English with some interest in entering the professoriate.
Our focus on this metric should not be seen as conveying a sense that these positions are more valuable than the many other types of occupations our PhDs pursue.
A significant number of our alums choose to stay in academia. Out of the 152 students who have earned English PhDs over the past 10 years, 33 (22%) hold non-tenure-track positions. Of these 33 positions, four are post-docs; four are permanent non-t-t faculty jobs; and 25 are annual teaching positions. Our PhDs have been successful in gaining administrative positions in academia. Over the past decade, 19 (13%) of our alums have accepted offers in advising, communication, management and curriculum development roles in universities.
About 20% of our students have careers outside academia. They teach in independent high schools; work as communications specialists in corporations; help manage nonprofits; and hold positions in banking, software, publishing, and other industries.
According to Federal Reserve data surveying PhDs in all fields, almost all holders of doctorates gain employment: the unemployment rate among PhDs hovers between 1% and 3%. Our data suggest the same is true for graduates of our program, with very few remaining unemployed.
English PhD Placement: Trends
While our overall rate is 58%, in recent years, the proportion of our PhDs entering the tenure track has been lower:
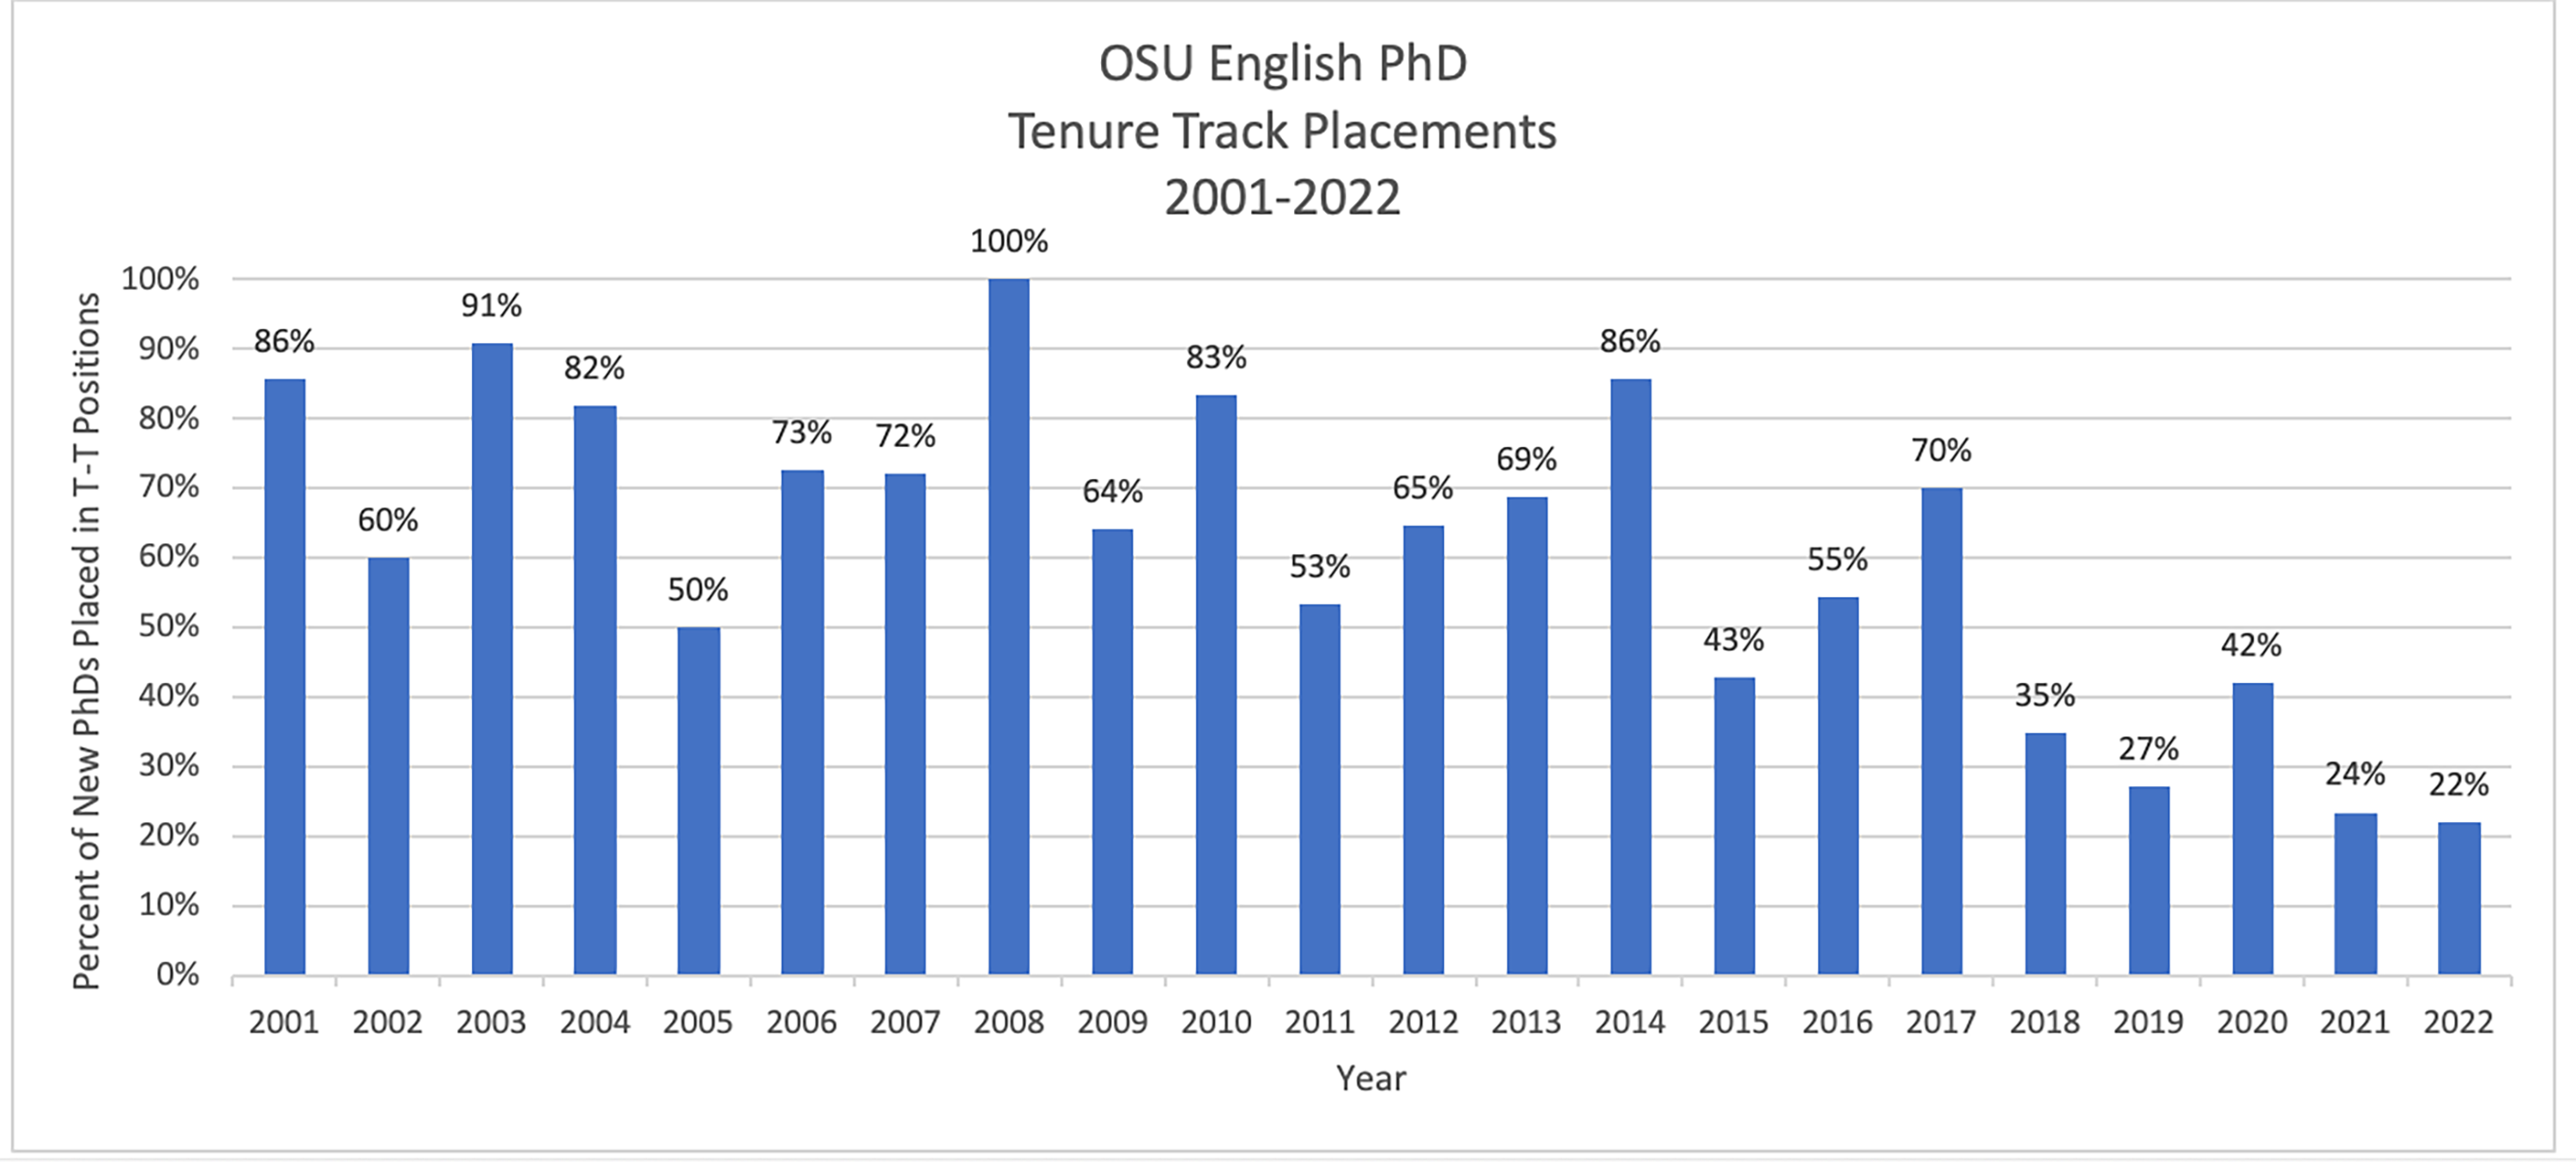
Image Description: The graph shows the percentage of Ohio State English PhDs who entered tenure-track professorial jobs for each year from 2001 to 2022.
The percentages are as follows: 86% (2001); 60% (2002); 91% (2003); 82% (2004); 50% (2005); 73% (2006); 72% (2007); 100% (2008); 64% (2009); 83% (2010); 53% (2011); 65% (2012); 69% (2013); 86% (2014); 43% (2015); 55% (2016); 70% (2017); 35% (2018); 27% (2019) 42% (2020); 24% (2021); 22% (2022)
PhD Placement: Writing, Rhetoric, and Literacy
Even though we have seen a steep, overall decline in t-t placements, it is important to recognize that this decline has been driven almost exclusively in the reduction of literature and folklore PhDs receiving tenure-track offers. A high percentage of our PhDs in our Writing, Rhetoric, and Literacy program gain t-t faculty positions each year – a percentage that has not changed, even as the market for PhDs in literary and cultural studies has shrunk considerably. As the following chart shows, since 2018, while 17% of literature PhDs have entered tenure-track positions, 77% of WRL PhDs have done so – and the rate of t-t placements among WRL PhDs has remained steady for the past two decades:
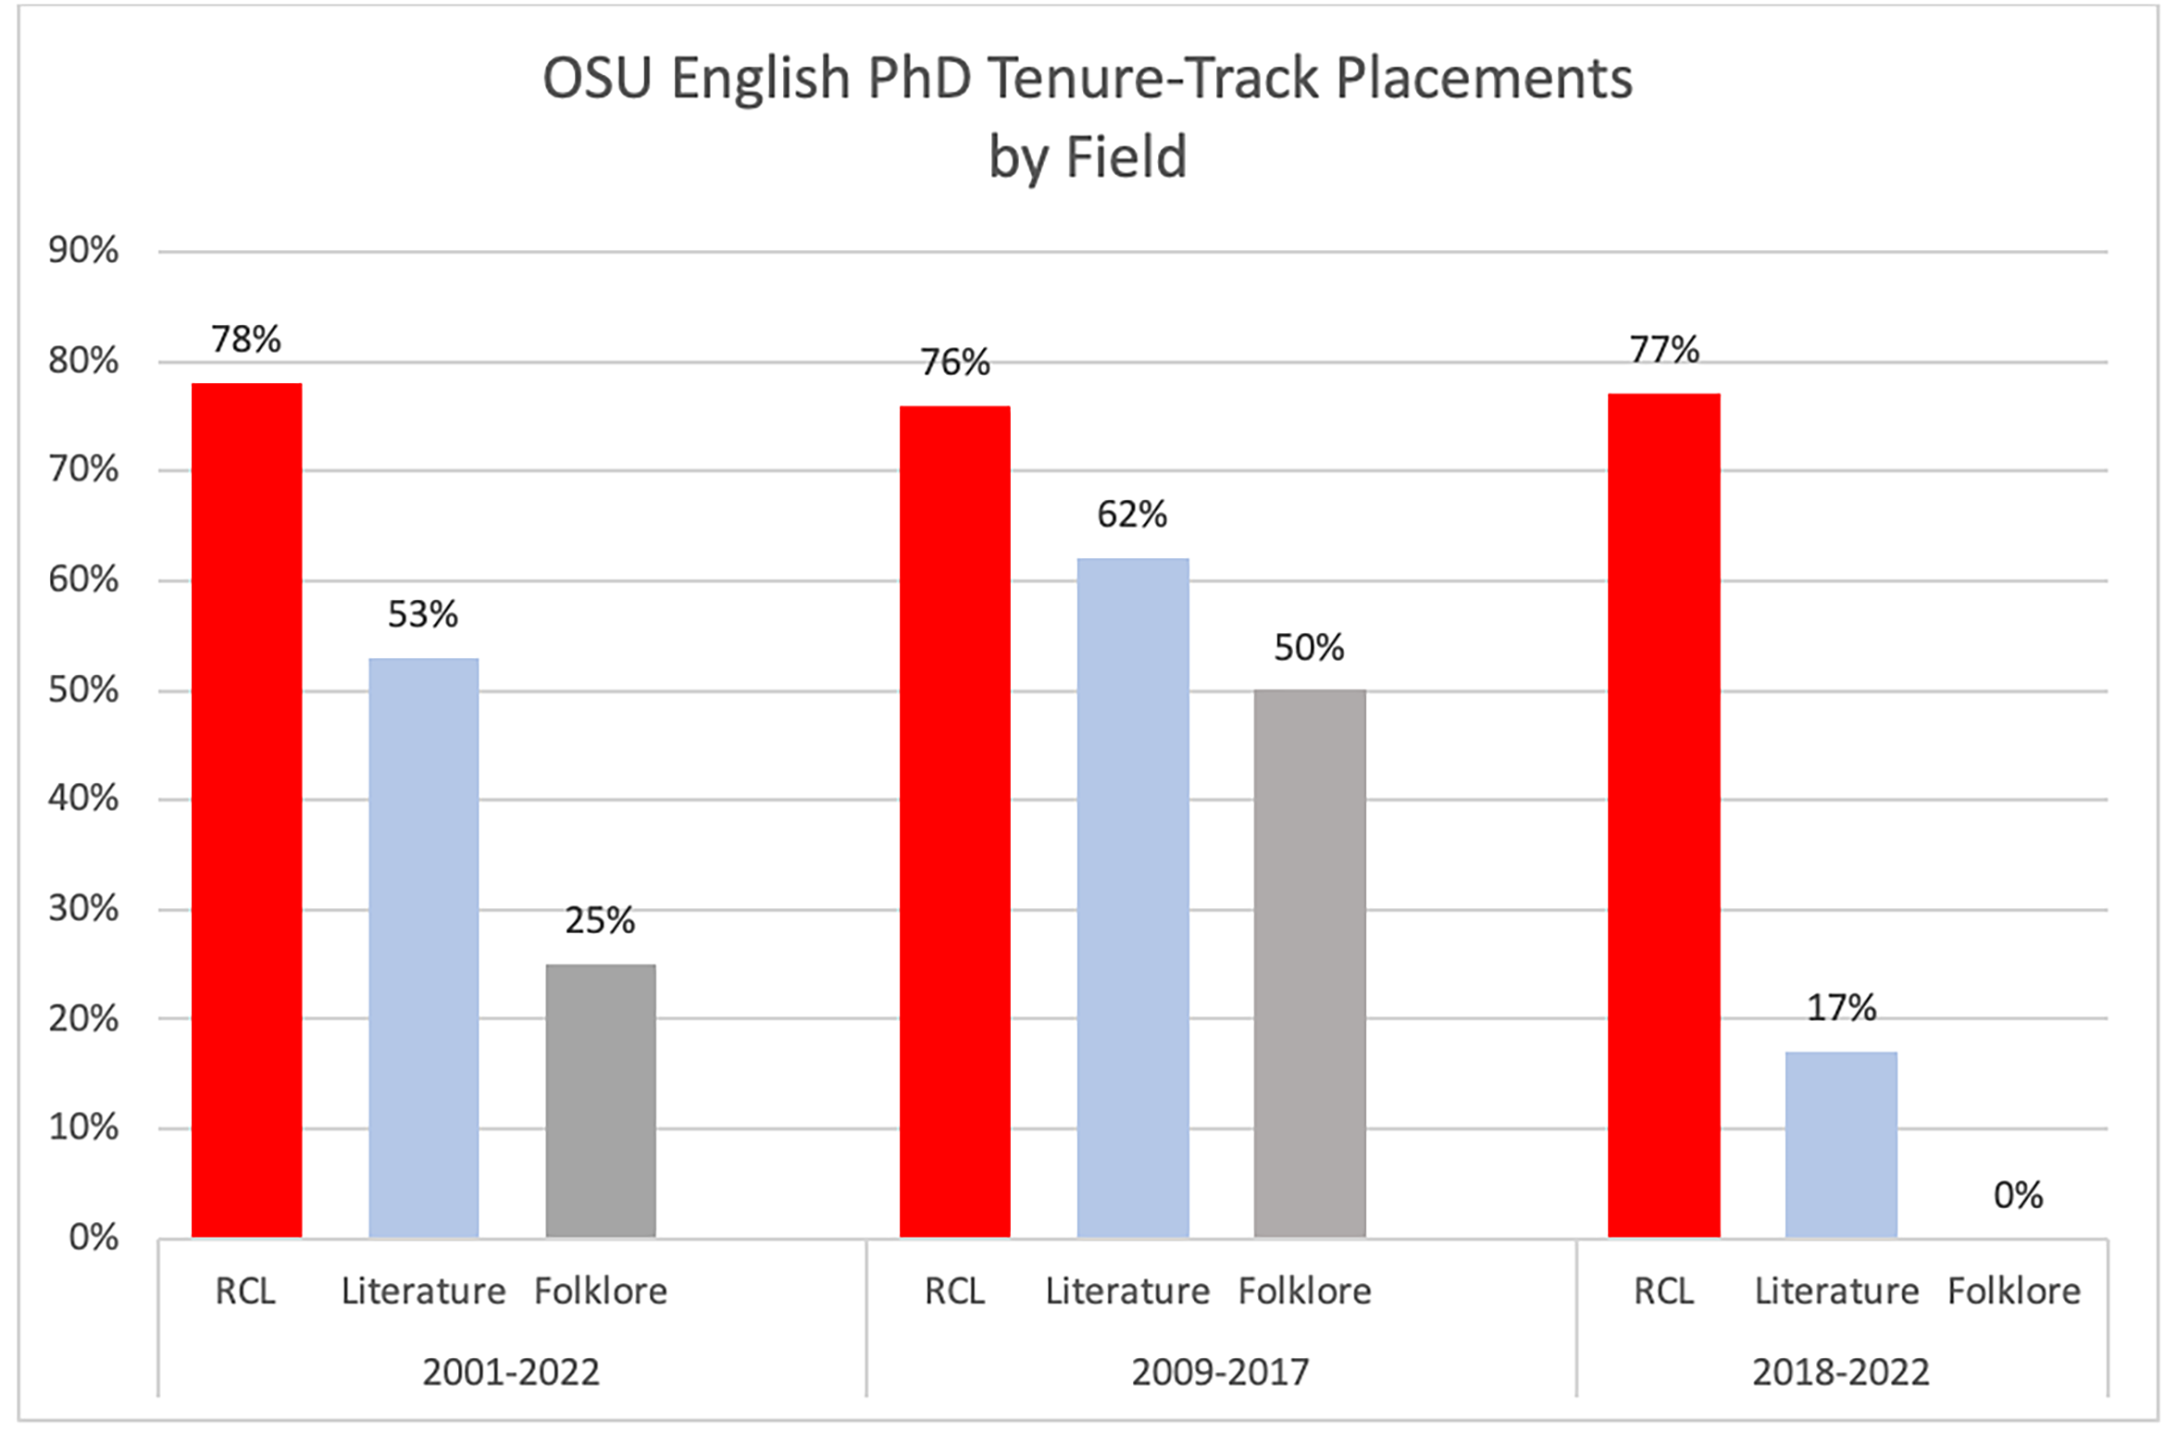
Image Description: This graph shows the differences in tenure-track placements for English PhDs who have specialized in three fields: WRL, Literature, and Folklore. It shows these differences in three time periods:
- From 2001 to 2022, 78% of English PhDs specializing in WRL gained tenure-track jobs. The percentage for those specializing in Literature PhDs was 53% and for Folklore, 25%
- From 2009 to 2017, 76% of WRL PhDs gained tenure track jobs. For those specializing in Literature, the percentage was 62% and for Folklore, 50%.
- From 2018 to 2022, 77% 76% of WRL PhDs gained tenure track jobs. For those specializing in Literature, the percentage was 17% and for Folklore, 0%.
Comparative Data
A comparison between our PhD placement rates and those of other large public institutions indicates that our outcomes over the past few years are in line with national trends.
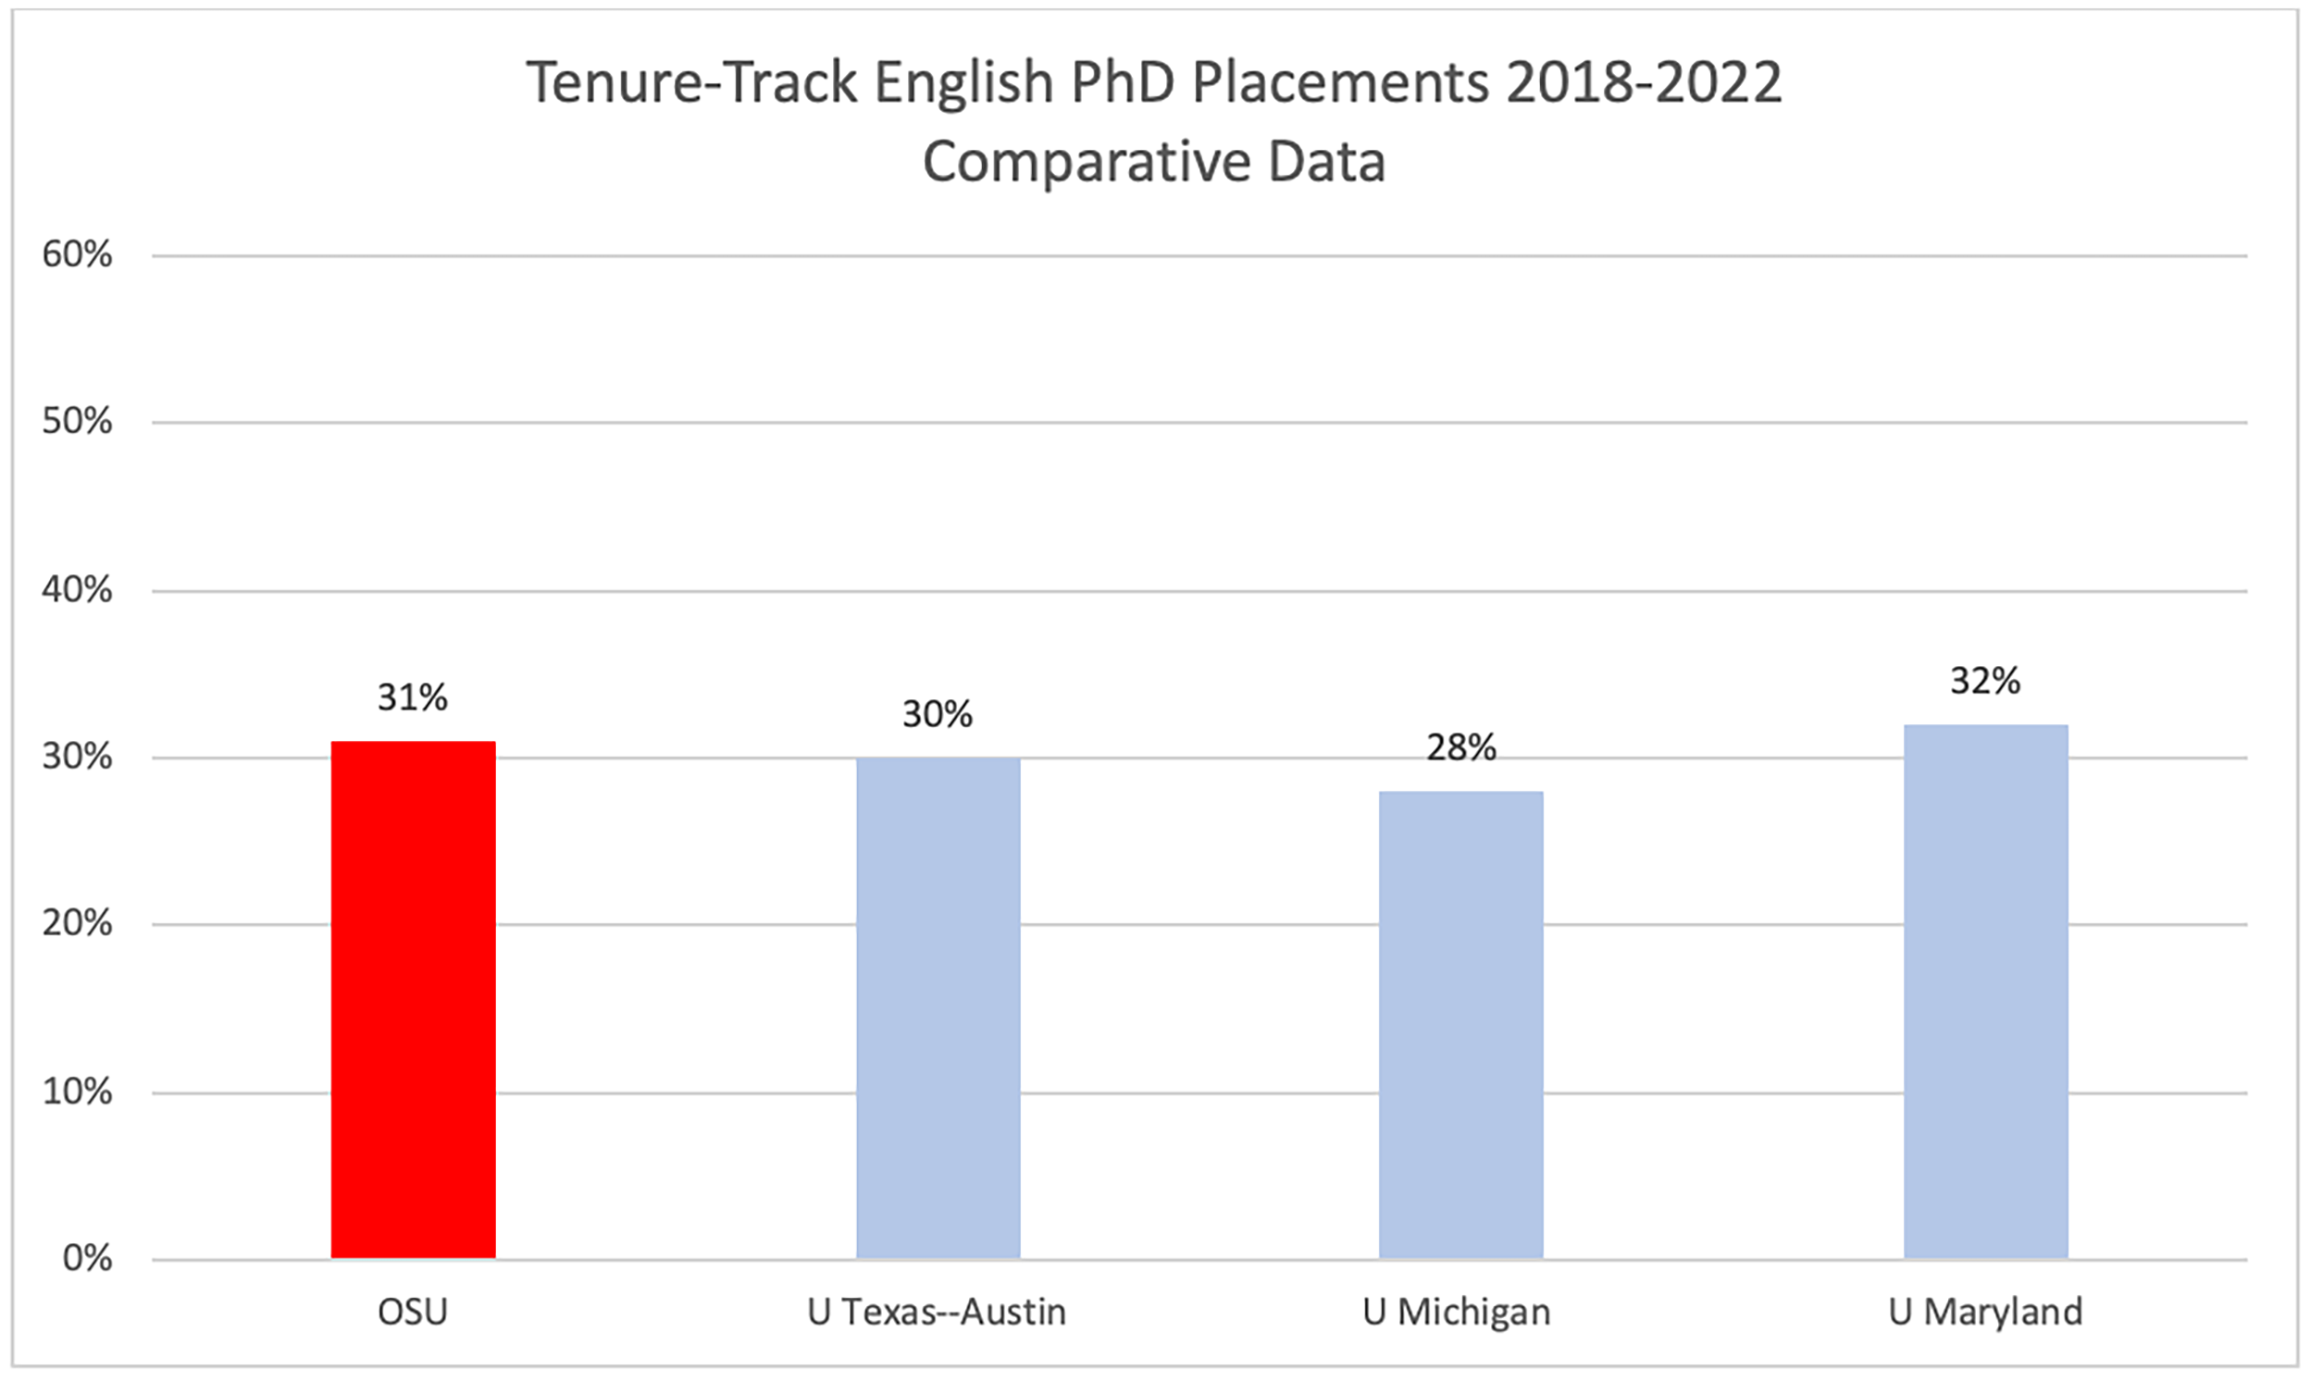
Image Description: This graph compares tenure-track job placements for English PhDs granted between 2018 and 2022 among 4 institutions.
At Ohio State, our percentage of PhDs with tenure-track placement in these 5 years was 31%; at University of Texas-Austin, it was 30%; at University of Michigan, it was 28%; at University of Maryland, it was 32%.
Sources: U Texas, U Michigan, U Maryland
Comprehensive Data
*For an accessible version of this chart, please download the Excel file below:
Notes:
- Overall, our tenure-track placement rate for PhD's from 2000/1 to 2021/22 is 58.0%. Subdivided down into individual fields, WRL is 79.7% (55 of 69); Literature is 53.4% (111 of 208); and Folklore is 25.0% (4 of 16).
- For 2000/1 to 2007/8, our overall rate is 76.4% (68 of 89), and in individual fields: WRL, 86.4% (19 of 22); Literature, 75.0% (48 of 64); Folklore, 33.3% (1 of 3).
- From 2008/9 to 2016/17, our overall rate is 64.1% (75 of 117), and in individual fields: WRL, 76.0% (19 of 25) ; Literature, 61.6% (53 of 86); Folklore, 50.0% (3 of 6).
- For 2017/18 to 2021/22, our overall rate is 31.0% (27 of 87), and in individual fields: WRL, 77.3% (17 of 22) ; Literature, 17.2% (10 of 58); Folklore, 0.0% (0 of 7).
Career Development Resources
Graduate students are encouraged to begin planning their careers early in their tenure in English program.
- The Office of Alumni Career Management and The Office of Student Life's Career Connection provide assistance with professional development and career counseling.
- The Graduate School also provides an overview of Ohio State's career development services for our students.
- The Office of Alumni Career Management provides online career resources, individual career advising and career programming. The office also facilitates the Buckeye Network on LinkedIn and hosts the Buckeye Job Board, where full-time career opportunities are posted.
- Career Connection provides services for graduate and professional students interested in learning more about how to pursue a professional position in academia. They also provide individual career counseling, career assessment, career resources and career group counseling. Notably, Career Connection can help with developing materials needed to promote yourself to higher education institutions (i.e. cover letters and curriculum vitae). They also help improve interview skills through role play and videotaped mock interviews.
- The Versatile Ph.D. is a resource for members of the graduate community at Ohio State who are interested in exploring non-academic career options for graduate students. It is open to Ohio State faculty, staff and graduate student alumni who are within one year of finishing their degrees. To log in through the Ohio State page, visit the Graduate School's Career Guide.
- The Graduate School's Preparing Future Faculty program offers Ohio State graduate students the opportunity to experience firsthand the unique challenges and rewards of an academic career at a smaller college or university.
Placement officers
For students who wish to pursue an academic career, the Department of English provides placement officers to help guide students through the process of the academic job market. In 2022-23, the placement officers are Professors Jonathan Buehl and Jacob Risinger.
The placement officers hold a meeting in the spring to share information about preparing to go on the job market when the MLA Job List is made available in the coming fall. Additionally, the placement officers are available to review application letters and other materials which students will be sending out in support of applications to academic positions. In October and November, the placement officers set up mock job interviews for those students who want the experience before going to the MLA Convention in early January. Sample job market materials are available in the graduate program office, 425 Denney Hall, and on BuckeyeBox. For access to the BuckeyeBox, please email graduateenglish@osu.edu.
Teaching Development
In addition to the training TAs receive in the First Year Writing Pre-Semester Workshop, graduate students can visit the University Center for the Advancement of Teaching to help teachers "excel in teaching, support student learning and experience the satisfaction that results from teaching well." Professional teaching consultants are available to discuss teaching techniques, developing course materials, designing courses or evaluating teaching efficacy. UCAT mantains a library of resources on teaching and learning and also hosts workshops, seminars and grant programs on teaching topics.
A variety of jobs and opportunities exist for people with MAs and PhDs in English. There is a shortage of people in the private sector who have the high-level critical reading and writing skills that graduate students in the humanities have — and those skills are needed. The department recognizes this and considers it important to provide support for students who want to find work outside of the academy. The most obvious options for non-academic jobs include business writing (i.e., corporate communications), public relations, technical writing, grant writing, communication consulting, corporate training and a wide array of jobs in publishing, but other career paths are available.
Visit The Chronicle of Higher Education's Career Network, with job listings, information and advice on careers both inside and outside academia. Also, visit two sites dedicated to providing information and resources about non-academic careers for Ph.D.s: The Versatile PhD, a website started by Paula Chambers (Ohio State Department of English PhD, 1999), and Re-envisioning the PhD.
Preparing for a Non-Academic Career
Consider becoming a member of a professional association that is relevant to your ambitions. Professional organizations usually publish journals that will provide invaluable information about their fields. The Association for Business Communication, for example, publishes The Journal of Business Communication and Business Communication Quarterly.
Take advantage of opportunities to teach in computer-supported classrooms and resources provided by the Digital Media Project. In the business world and in the academy, there is an increasing interest in electronically-mediated writing and other communication technologies. It is helpful to teach with computers because you learn how to adapt to computers other than your own and help others do the same. Even if you won’t be teaching, you almost certainly will be adapting to other people’s computers.
Additional Advice on Non-Academic Careers
- Attend departmental workshops on non-academic careers
- Enroll in graduate courses in other departments, but talk to your advisor before accruing too many extra-departmental hours
- Talk to graduates and current graduate students who are pursuing non-academic careers to find out how they arranged their programs to suit their needs
Finally, each year, the Graduate Program and the English Graduate Organization organize a range of events and opportunities for students to learn about various aspects of the profession, to develop and practice relevant skills and to prepare for academic and other careers.
The Department of English will allow each current English graduate student a total of two years of Dossier Service support for a nominal fee. English graduate students must utilize their two years of Dossier Service support while in funding (via department funding or fellowship) or within two years of graduation/having been out of funding. In order to take advantage of the Department of English Dossier Service, graduate students must follow the procedures below. It is the graduate student's responsibility to contact the appropriate program coordinator about transferring their dossier to another service when access to the English department's service has ended.
Open a Dossier Service file
- Obtain dossier forms from the appropriate program coordinator. PhD students: Kathleen Griffin, 425 Denney Hall, griffin.328@osu.edu. MFA students: cwMFA@osu.edu.
- Complete the Dossier Credentials Form.
- Complete the Request for Recommendation Form for each reference individual.
- Contact references to ask for letters of recommendation and obtain the reference’s signature on the Request for Recommendation Form.
- Turn in the Dossier Credentials Form and all Request for Recommendation Forms to the appropriate program coordinator.
Request that a new dossier is sent to a specific institution
- Dossier requests will be made by completing a spreadsheet which will be shared with you via Ohio State's BuckeyeBox. BuckeyeBox is a free online content storage, sharing and collaboration service available to Ohio State students, staff and faculty. For more information about BuckeyeBox and to sign up for your access, please visit: https://box.osu.edu/.
- Once you have set up your BuckeyeBox access, please notify the appropriate program coordinator that a dossier request spreadsheet can be shared with you.
- PhD students: Please send a message to Kathleen Griffin, griffin.328@osu.edu. MFA students: Please send a message to cwMFA@osu.edu.
- The program coordinator will reply with a message once a dossier request spreadsheet has been created and shared with you. Access your spreadsheet on BuckeyeBox and follow the prompts to open your spreadsheet. Click on “Edit” to update the spreadsheet.
- Populate all applicable fields within the spreadsheet. Please note that we will fill in the purple highlighted fields. Please populate each request on the spreadsheet individually; you may change the column widths to accommodate the information that you are entering on the spreadsheet.
- Notify the program coordinator when you’ve updated the spreadsheet with a new request.
- The coordinator will reply once the request has been sent and the spreadsheet has been updated.
- Check the updated spreadsheet purple highlighted fields to review the date when the dossier was sent for each request.
Multiple requests
Within the same Dossier Service year, you may request multiple dossiers be sent to specific institutions. Continue to utilize the spreadsheet on BuckeyeBox so that an ongoing history is captured on one spreadsheet. Again, it is your responsibility to notify the program coordinator when you’ve updated the spreadsheet with a new request.